4
 173 California’s Courts: Judicial Administration and Case Flow Management
Abstract
The Judicial Council of California is the central policymaking and administrative agency of California’s court system. In this chapter, the author discusses the current status of the Council’s efforts to implement more effective judicial administration and case flow management. The author highlights the challenges posed by lack of centralised data, severe loss of funding due to national recession, and emphasis on local decision-making rather than statewide standards in the context of implementation of trial court unification, measurement of judicial workload, and operation of courts. She concludes on a hopeful note, however, noting that several initiatives are underway to improve data measurement and collection, workload models, and allocation of judgeships, so that all Californians may get better access to justice.
. . . . .
The Judicial Council of California is the central policymaking and administrative agency of the California state court system and strives to provide data and analytics to improve judicial administration and case flow management in California’s trial courts. Despite becoming a unified and state-funded system about 20 years ago, there are continued differences in case processing practices and service levels across California’s 58 counties. A crippling recession that severely cut funding to trial courts starting in 2012, a lack of centralised case data, and variation in local practices pose challenges to fully implementing case flow management at the statewide level. Nevertheless, the California Judicial 174 Branch is moving in the direction of using data and analytics to support funding requests for the courts, making it important than ever to enhance the measurement and reporting of case flow management indicators.
The United States of America has two primary judicial systems: the federal judiciary and the state judiciary.1 The overall structure of the two systems is the same: lower courts that hear the majority of matters; courts of appeal that provide judicial review of lower court decisions; and a Supreme Court to review decisions made at the appellate court level. The two systems differ in the matters that each may hear, with the state courts hearing the majority of all criminal, civil, family, and probate matters.
Most cases in California originate at the superior court (also called ‘trial court’) level, where 1,676 judges hear matters in the 58 courts — one in each county. The courts of appeal both conduct judicial review of lower court decisions and directly receive certain matters which are not heard in the trial courts. Finally, the state Supreme Court reviews lower court decisions, hears appeals of death penalty cases, and oversees judicial and attorney conduct. Figure 1 depicts the structure and hierarchy of California’s court system.
Figure 1. California’s Court System
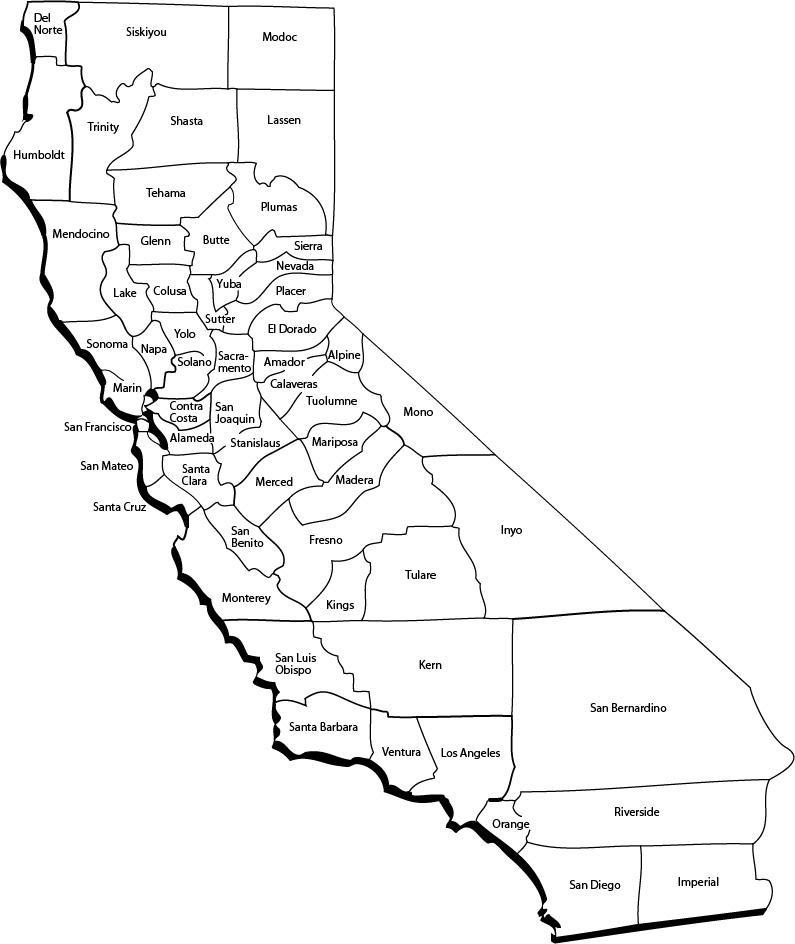
Map Source: California Association of Counties
175 California’s court system is one of the largest in the world, serving a population of nearly 40 million. In the fiscal year 2014–20152 over 6.8 million cases were filed in the superior courts. The majority of these cases are traffic infractions, matters such as speeding or making an illegal turn. Beyond that, 176 the work that comes before the superior courts in California encompasses the full range of issues that require legal adjudication, such as criminal matters, civil litigation, family and juvenile law, and probate.
The variation among the communities served by the California court system is tremendous. There is a superior court in every county in the state and over 500 facilities statewide where court business is conducted. The largest court, in Los Angeles County, serves a population of over 10 million, whereas the smallest courts serve communities of under 10,000 residents each. In addition to population variation, there is considerable differentiation in the communities served––some courts are located in high-density urban areas, whereas others serve more rural communities.
While population is not directly correlated with court workload, it serves as a useful indicator of the need for court services generally. Although California has experienced steady population growth throughout the state, that growth has affected communities unequally. The suburban communities that surround established urban areas have experienced high rates of population growth as people move to the outskirts of urban areas seeking lower-cost housing. Further, staying consistent with trends in other states and countries, rural areas have experienced very modest or negative population growth.
EFFECTS OF TRIAL COURT UNIFICATION
Prior to trial court unification, these wide disparities mirrored the variation in service that courts provided to users. In the early years, the courts were operated at the county level, with all operational and funding issues handled in a decentralised manner by local government. While some communities had the means to provide adequate funding to the Judicial Branch, others were not as able or willing, and the quality of service provided to the public was uneven as a result.
The Trial Court Funding Act of 19973 sought to change that by instituting state funding of trial court operations. In addition to changing the funding structure for trial courts, the goal of having a state-funded system was to create uniform standards and procedures for consistency of experience for court users and implement structural efficiencies and economies of scale for the more effective operation of the courts.
In the years following the passage of the Act, a number of steps were undertaken to implement unification. In addition to the centralisation of funding, these included revision of laws, adoption of new rules that would be applicable to all courts, standardisation of forms, and consolidation of many administrative functions. One step that had a profound impact on judicial administration and case flow management was developing a model to evaluate judicial workload across all trial courts.
At the time of unification, the California courts had vastly different judicial resource levels. While some counties seemed to have enough resources, others, particularly in high-growth areas, did not appear to have enough judgeships. At the time, the Judicial Branch did not have a means of evaluating how many judicial officers might be needed compared to the numbers that were appointed in each court. Under the decentralised funding model that was in place prior to state funding, trial courts could submit requests for additional judgeships to local legislators. In doing so, these requests were 177 evaluated on an individual basis, without requiring consideration for the needs of other courts. Jurisdictions were often successful in getting new judgeships based on the relationships these courts had established with those legislators. It comes as no surprise that some jurisdictions were more successful at obtaining new judgeships while others were not as successful.
Once centralised, the Judicial Branch needed to establish a ‘yardstick’ to measure judge need across all courts and to advocate to the state legislature the need for new judgeships using data. Adding to the challenge was the tremendous variation among the courts, as mentioned above. Partnering with the National Center for State Courts (NCSC), a national court organisation that serves as a resource for many aspects of state court judicial administration, the California courts embarked on a workload study to evaluate the amount of resources needed for trial court operations. The approach taken is called ‘weighted caseload’ and is a nationally recognised methodology for assessing court workload by measuring the amount of time needed for cases of various types. The weighted caseload method developed by NCSC has been implemented in nearly 30 states to assess the need for judges, court staff, and other judiciary-related entities. Weighted caseload is based on the premise that cases of different types require different amounts of resources; for example, a homicide case has more hearings and other workload compared to a minor traffic matter. This methodology is also useful when jurisdictions have different case mixes, as is the case in California where two counties of a similar population can have very different workload profiles based on the demographics of the residents, the number of major roadways that pass through the area, and other factors. A weighted caseload method accounts for these differences and can be used to direct the appropriate number of resources to each court.
CHALLENGES OF A STATEWIDE WORKLOAD MODEL
To estimate the amount of time needed for case processing work, a time study is conducted in a sample of courts to determine the average amount of judge time needed to resolve cases of varying case types. The courts selected to participate in the study are chosen on the basis of several criteria that are intended to represent the diversity of the California court system: size (small, medium, large); geographic diversity (urban and rural); and funding level (well-resourced and not well-resourced). During the study, judges fill out a time sheet that describes various activities that they perform and the amount of time allocated to each. The data collection period lasts approximately two to four weeks and takes place in the spring or fall, during a period when there are few holidays or vacations. The time study is intended to capture the distribution of the judge’s time to various activities; all judges in a court that is being studied must participate so that the results give a complete picture of how the court allocates its resources.
The time study results in a set of preliminary estimates, called case weights, that estimate the time that cases of various types take. The case weights are statewide measures that represent average values across all of the courts that participated in the study, and there are weights for about 20 different case types. The number of weights that are used to measure workload are determined by two criterias: whether the Judicial Branch has the filings data to measure the volume of work for that particular case type and whether the workload for that case type is sufficiently different from that of other case types so as to require separate measurement. For example, the workload of a felony case is much more than what would be required to manage a traffic infraction, and, therefore, it makes sense to measure those types of cases separately.
178 Next, a series of adjustments are made to ensure that the time study data provides a sufficient measure of case processing time. These adjustments include reviewing data with the study courts to make sure the results are consistent with expected values and speaking with focus groups of judges to determine whether adjustments might be needed to account for backlogs or overtime. When the case weights are finalised, estimates of the number of judicial officers needed based on workload can be computed by multiplying the case weights by the annual filings for a particular case type and dividing by the amount of time judicial officers have for their work.
California first conducted a time study as part of implementing a weighted caseload method in 2001. The analysis was updated in 2009 to measure differences in workload that resulted from changes in the law, technology, or case processing practices in the intervening years. For example, electronic filing of documents and the growing practice of scanning documents has eliminated, or at least reduced, much of the manual data entry that clerks previously did. New laws such as those relating to domestic violence cases that were implemented to improve the safety of victims have created new types of workload for court clerks, such as verifying that the perpetrator has relinquished all firearms.4 The California Judicial Branch is currently planning another study, as there have been several changes, particularly in criminal case processing, since the workload study was last conducted. Technology has also improved exponentially since then––fillable forms, electronic filing, and automated phone customer service are just some of the many modes of service that have become available to courts and court users in recent years and that affect case processing.
Since courts still operate largely at the local level, the practices and standards in place at the individual participating courts are memorialised in the workload measures used to identify resource need. One perspective on this is that the workload measures embody a range of various practices and outcomes, staying neutral as to what constitutes a ‘best’ or effective practice. This approach is useful when there is little or no information about the underlying case processing practices and how those practices contribute towards the overall time and resources need to move the case to disposition.
Another approach, and one that has been attempted to varying degrees in the workload models used in California, is to identify and study courts that exemplify specific policies or principles of court performance, and to create workload measures that reflect those policies and principles. The result would be a workload model with a prescribed level of service or performance. This approach has not yet been successfully implemented in California. Variation in local practices makes it difficult to reach agreement on what constitutes a best practice. This is further hampered by judges’ perceptions that any sort of standardisation of practice could impede their ability to render decisions in cases with complete independence. Earlier attempts to identify best practices or baseline levels of service were hindered by uneven resource levels across courts. Courts with insufficient funding were able to argue compellingly that they did not have the financial means to implement new or different practices, making standardisation difficult to achieve. As a result, these early efforts to establish standard practices or performance-based workload measures were abandoned.
STATEWIDE MEASURES OF CASE FLOW MANAGEMENT
The California Standards of Judicial Administration outline time goals for case processing in certain 179 case types and court performance is tracked in the Court Statistics Report.5 These goals were adopted as part of the Trial Court Delay Reduction Act of 1986, and are consistent with national time standards, as adopted by the National Conference of State Trial Judges and the American Bar Association.6 Outside of the time goals, there is little in the way of statewide direction on case processing practices that might improve case flow management, other than what might be mandated by law. As described above, individual trial courts are given the latitude to determine how best to manage cases, with little guidance in the way of performance measures or standardised practices. The judicial council compiles best practices and offers training for various case management issues, but does not currently promulgate statewide standards for case processing or case flow management.
LOCAL CASE FLOW MANAGEMENT IN PLACE OF STATEWIDE MEASURES
Anecdotally, it is known that individual trial courts do track and manage judicial workload locally, but the individual efforts of the courts are not compiled or accessible by the judicial council, nor are the indicators measured systematically to ensure uniform reporting. Site visits and conversations with courts show that indicators such as case ageing and backlog are tracked to ensure that judges have an appropriate number of cases relative to their peers and that statutory time limits are met. However, this decentralised approach results in a lack of consistency across courts, which makes it difficult to use this data at the statewide level to advocate for more resources. For example, if the Judicial Branch could demonstrate that the number of cases that met statutory time limits was decreasing due to limited funding, it could urge lawmakers to provide additional funding in order to improve case processing time. Or, if the branch had the authority to mandate certain practices, it could obtain funding to implement processes that were known to improve outcomes for court users.
CALIFORNIA LACKS A CENTRALISED CASE PROCESSING SYSTEM
Another challenge to a statewide case flow management is the difficulty of obtaining statewide data that could be used as workload indicators. For example, data on the number, types, and occurrence of hearings could be useful in tracking the trajectory of cases and figuring out where bottlenecks occur and how to resolve them. However, the Judicial Branch has been unsuccessful at implementing a centralised computerised case management system. An effort to do so was ended about five years ago because of large cuts to the Judicial Branch budget that made it infeasible to complete and deploy the new system. Instead, each jurisdiction maintains its own case records, and there is no interaction between the case management systems. While certain case data and case flow management indicators are reported centrally for publication in the Judicial Branch’s Annual Court Statistics Report,7 such as filings and dispositions, the data are submitted in aggregate format. The branch does not have access to case information such as the case number, charges, or demographic data on the parties — data that is vital for many case flow management measures. This lack of data limits the Branch’s ability to evaluate or compare courts on the basis of workload.
COURT WORKLOAD IS AN ‘OUTCOME’ OF THE JUSTICE SYSTEM
180 Perhaps more so than any other part of the legal system, courts have a very passive role relative to the matters that come before them. Courts cannot choose to not accept certain cases. Law enforcement, legislative changes, and local practices influence the number and type of cases that come to the trial courts.
The Role of Justice System Partners
At the end of 2007, California and the rest of the United States of America entered into a severe recession. The recession’s impact on the courts generally are discussed in further detail later in this chapter; however, in terms of court workload, the recession changed behaviour in the agencies that interact with the trial courts. When local police departments’ funding was cut as a result of the recession and corresponding loss in public sector funding, those agencies concentrated their limited resources on more serious crimes while cutting back on enforcement of lower-level crimes, such as traffic misdemeanours and infractions. Criminal case filings trends during this period, as depicted in Figure 2, substantiate this hypothesis.
Figure 2. Ten-year Trends in Criminal Filings
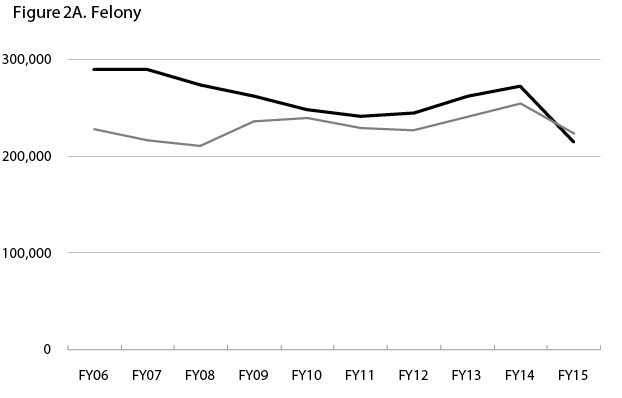

Source: 2016 Court Statistics Report (annotated to show recession period)
181 For trial courts, this meant fewer filings were coming in, but it also meant that the fee revenue that comes from certain filings, particularly the lower-level offences, dried up as well.
County prosecutors and defence attorneys similarly changed their operations in response to funding shortfalls. Though difficult to substantiate with data, some courts relayed that prosecutors were having to change their operations to maximise limited resources. With reduced funding, fewer attorneys on staff would be available to bring cases to court. This potentially resulted in delays or backlogs in prosecuting cases that were beyond the ability of a court to mitigate.
Also, the relationship between the district attorney, who prosecutes matters on behalf of the ‘state’ 182 or the ‘people’, and the public defender, who represents accused persons who cannot afford private counsel, has a profound impact on case flow management in a court. Each county has its own elected district attorney, who is responsible for charging criminal matters. In some jurisdictions, the court, district attorney, and public defender meet regularly to discuss case flow management and administrative issues that they have in common. These courts anecdotally report that the mutually respectful relationship results in better collaboration and problem-solving. For example, district attorneys and public defenders who work collaboratively will try to resolve cases through plea agreements in order to reach a resolution more quickly than taking a case to trial. These negotiations are contingent on both parties trusting that the other is making the best possible offer and can require compromise and flexibility. While each of those entities has their own agenda and mission, coming together to resolve common issues creates a problem-solving atmosphere that may result in better outcomes for all involved.
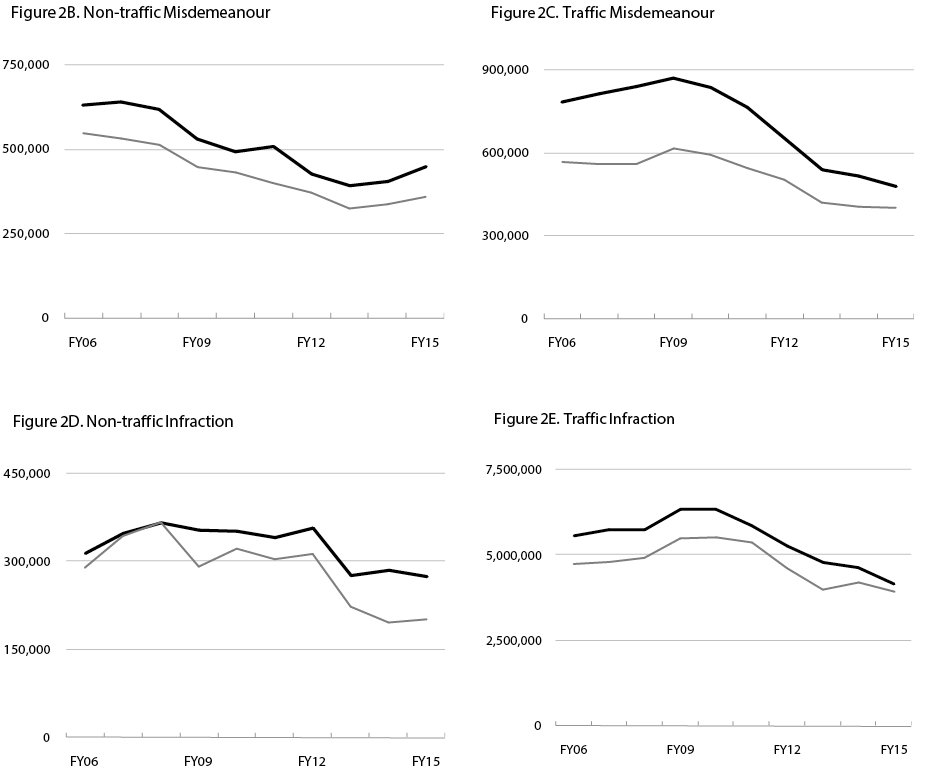
In those jurisdictions where the relationships either are not as positive or where there is no overt coordination, there is less negotiation and compromise, and courts relate anecdotally that this appears to create obstacles to better case flow management. The trial rate data collected in the Annual Court Statistics Report is indicative of this issue. While the law provides for a defendant’s right to a speedy trial, most matters are resolved at an earlier stage in the case, resulting very few trials. Trials are extremely resource-intensive, requiring much more staff and other resources to conduct. For example, in a trial, a court reporter must be present to create a written record of the proceedings. During trials, clerical staff assigned to the judge must be present in the courtroom, meaning that they cannot attend to other matters while the court is in session.
The average jury trial rate for felonies, as shown in Figure 3, is 2 per cent, meaning that of all the felony cases that were disposed of in a particular year, that proportion was resolved by jury trial. For courts where the relationship between the two entities is more adversarial, the trial rate can be considerably higher, tying up limited resources to hear those cases.
Figure 3. Felony Dispositions for Fiscal Year 2016–2017 by Type of Disposition
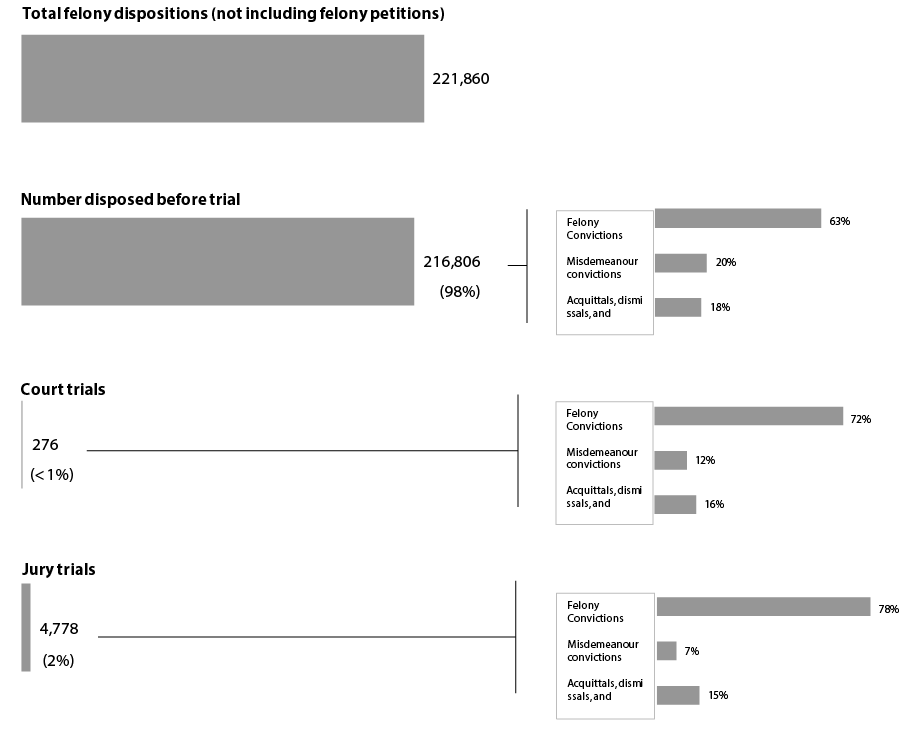
Source: 2016 Court Statistics Report
183 Legislative Changes Affect Court Workload
Changes in the law relating to prison population and sentencing have changed both the volume of cases coming to courts and the role of courts in managing criminal workload. Since 2009, a series of legislative reforms (AB 109, criminal realignment, Proposition 47) have sought to reduce the number of crimes that are prison-eligible and alleviate severe overcrowding in the prison system by creating alternative punishments that could be locally served. While improving outcomes for society at large, these measures added new responsibilities to the courts that increase the number and type of hearings and create other forms of workload. One type of change is that courts are now responsible for conducting hearings that were formerly conducted by another state agency.
Another recent change brought about by Proposition 47 reduced many lower level felony offences to misdemeanours. This changed court workload by decreasing the number of felony cases filed, which are more time and labour intensive 184 for court staff and judicial officers to process, and increased the number of misdemeanour filings. The new law also made it possible for persons who had been previously convicted of one of the felony crimes that was downgraded to a misdemeanour under Proposition 47 to apply for a reclassification. Since a felony conviction is a major barrier to employment, many people chose to take advantage of the opportunity. This created additional workload for courts, both to process the applications for reclassification and to locate the original court records for the applicants, as the law encompassed any eligible felony conviction regardless of the age of the conviction.
Recession and Impact on Workload Analysis
The recession had a severe impact on trial court funding, and today, even though the recession officially ended in 2009, trial court funding has not recovered fully. After a succession of steep cuts to the court budget beginning around 2012, the courts are funded at about 75 per cent of the total amount needed according to the courts’ workload-based funding model.
One silver lining to the reduced funding was that it caused trial courts to overhaul their operations to make them as efficient and cost-effective as possible. Some courts closed outlying locations that were no longer cost-effective to operate. Courts analysed their business processes, studied their operations, and consolidated functions in an effort to stretch their limited resources.
Despite these changes, it came as a surprise to some that a recent time study of court case processing staff showed that some types of cases were taking more time to complete compared to previous years.8 The assumption among many had been that fewer filings and more efficient practices would mean that courts would be operating in a more streamlined manner and require fewer resources. The data showed otherwise. As described previously, legislative changes designed to improve outcomes for litigants have increased court workload. These changes appear to have outweighed or at least neutralised efficiencies gained through business process re-engineering efforts.
This illustrates that case flow management is not completely under the control of courts; while courts can institute some oversight over processes that move cases towards disposition, outside entities and external events also influence workflow in the courts.
CONCLUDING THOUGHTS
Judicial administration and case flow management are critical to better understand the court workload and branch funding need. California continues to work towards improving its efforts to enhance measurement and data collection in this area. Looking forward, there are many initiatives underway. On the data management side, many courts are upgrading ageing or failing case management systems to enhance data collection. This may present opportunities to review data definitions and seek ways to establish communication across disparate case management systems. On the resource side, California continues to improve its workload models and allocation of judgeships to make the best use of its funding. All of these efforts are undertaken in the spirit of the core mission of the California courts: to increase access to justice for all Californians.
185 Notes
1. A more detailed delineation of the two judicial systems can be found at http://www.uscourts.gov/about-federal-courts/court-role-and-structure/comparing-federal-state-courts (accessed on 27 September 2017).
2. The fiscal year starts on 1 July and ends on 30 June.
3. Known as the Lockyer-Isenberg Trial Court Funding Act of 1997 (Assembly Bill 233), available online at http://www.courts.ca.gov/partners/documents/TCFWG-Meeting-11-6-12-Goals-of-Trial-Court-Funding-Act.pdf (accessed on 27 September 2017).
4. Section 6389, California Family Code, available online at https://leginfo.legislature.ca.gov/faces/codes_displaySection.xhtml?sectionNum=6389.&lawCode=FAM (accessed on 27 September 2017).
5. California Rules of Court, available online at www.courts.ca.gov/rules.htm (accessed on 27 September 2017).
6. The Trial Court Delay Reduction Act is available online at https://leginfo.legislature.ca.gov/faces/codes_displayText.xhtml?lawCode=GOV&division=&title=8.&part=&chapter=2.&article=5 (accessed on 27 September 2017).
7. Judicial Council of California. 2016. Court Statistics Report: Statewide Caseload Trends. San Francisco: Judicial Council of California. Available online at http://www.courts.ca.gov/12941.htm (accessed on 27 September 2017).
8. The study findings were presented to the Judicial Council at its July 2017 meeting. The final report is available at https://jcc.legistar.com/View.ashx?M=F&ID=5338582&GUID=FA2962D0-141A-40D4-B9CA-CB5C2467A49C (accessed on 27 September 2017).
———