
Are More Fresh Filings Causing Judicial Pendency?
- /
- Articles and Blogposts /
- Are More Fresh Filings Causing Judicial Pendency?
Have the number of cases filed in courts gone up so substantially as to be the main reason for the backlog of cases in courts? In the opinion of Justice Gopala Gowda, that is indeed so.
Speaking at the Lok Adalat organised by the Karnataka State Legal Services Authority on 12 December, Justice Gowda remarked, ‘The judiciary is not responsible for cases not being resolved in a timely manner. The government is not establishing courts in proportion to the increase in population and cases filed. Disposal of cases is being delayed due to this. The courts and judges are doing an excellent job in the disposal of cases. If there were an increase in courts appropriate to the increase in filings then there would be no question of judicial delays at all.” (as reported in the Kannada daily, Prajavani, on 13 December 2015).
So we asked ourselves: Is there really an increase in filings? And if yes, at what rate is it increasing?
Here are three time trends from the last updated data reported in ‘Court News’ reported by the Supreme Court ( can accessed here http://supremecourtofindia.nic.in/courtnews.htm).
In the Supreme Court
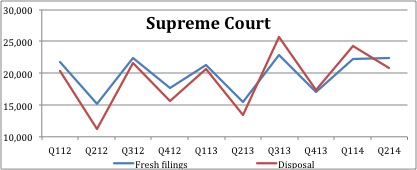
Figure 1: Trend of fresh filings and disposal in the Supreme Court over 10 quarters

Table 1: No. of fresh filings and disposal at the Supreme Court during the quarter:
| Q112 | Q212 | Q312 | Q412 | Q113 | Q213 | Q313 | Q413 | Q114 | Q214 | |
| Fresh filings | 21,706 | 15,187 | 22,403 | 17,621 | 21,342 | 15,551 | 22,813 | 17,036 | 22,287 | 22,459 |
| Disposal | 20,409 | 11,152 | 21,604 | 15,579 | 20,714 | 13,425 | 25,656 | 17,290 | 24,306 | 20,819 |
In the High Courts
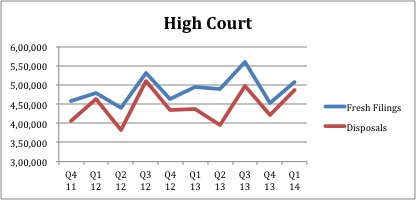
Figure 2: Trend of fresh filings and disposal in the High Courts over 10 quarters
Table 2: No. of fresh filings and disposal at the High Courts during the quarter:
| Q4 11 | Q1 12 | Q2 12 | Q3 12 | Q4 12 | Q1 13 | Q2 13 | Q3 13 | Q4 13 | Q1 14 | |
| Fresh Filings | 4,58,885 | 4,79,042 | 4,40,324 | 5,31,292 | 4,63,103 | 4,95,746 | 4,88,186 | 5,60,889 | 4,53,438 | 5,08,727 |
| Disposals | 4,07,265 | 4,64,312 | 3,82,189 | 5,10,841 | 4,34,049 | 4,37,176 | 3,94,487 | 4,98,202 | 4,22,947 | 4,86,115 |
In the sub-ordinate courts
Figure 3: Trend of fresh filings and disposal in the Subordinate Courts over 10 quarters

Table 3: No. of fresh filings and disposal at the Subordinate Courts during the quarter:
| Q4 11 | Q1 12 | Q2 12 | Q3 12 | Q4 12 | Q1 13 | Q2 13 | Q3 13 | Q4 13 | Q1 14 | |
| Fresh filings | 41,46,123 | 43,37,836 | 44,66,303 | 48,82,975 | 44,33,166 | 43,50,524 | 44,52,506 | 47,36,967 | 51,28,312 | 48,66,618 |
| Disposed Cases | 44,00,718 | 44,82,366 | 43,18,734 | 50,44,185 | 43,11,269 | 43,88,859 | 40,75,708 | 44,19,310 | 58,55,480 | 43,44,835 |
As can be seen from the charts, there has been some increase in the fresh cases being filed at all levels.
In the Supreme Court there has been a 3% increase of filings in Q2 ’14 as compared with filings in Q1 ’12. In the High Courts there have been a 10% increase of filings in Q1 ’14 as compared with filings in Q4 ’11. And in the Subordinate Courts there have been a 17% increase of filings in Q1 ’14 as compared with filings in Q4 ’11.
Clearly the level of increase is not drastic. In fact, the disposal level too seems to follow the trend of fresh filings. Therefore the rate of increase in the fresh filings does not appear to be the chief cause of judicial [ithoughts_tooltip_glossary-glossary slug=”pendency”]pendency[/ithoughts_tooltip_glossary-glossary] . Or rather it can not be said to be the only cause.
Practitioners and scholars alike have pointed out may factors like management of court diary, too many adjournments, lack of judges, etc., that contribute to the pendency problem. Understanding the chief causes for the steady worsening of the judicial pendency situation needs a closer scrutiny of the day to day operations of the judiciary.
(With inputs from Krithika Gururaj, student of Master in Public Policy programme at the Crawford School of Public Policy)
The views expressed in this article are solely those of the author’s and they do not represent the views of DAKSH.

Surya Prakash
RECENT ARTICLES


Civil Disputes, Criminal Justice Resolutions

Set the guardrails for AI use in courtrooms

Why ICAI’s audit limit is misguided and outdated

-
Rule of Law ProjectRule of Law Project
-
Access to Justice SurveyAccess to Justice Survey
-
BlogBlog
-
Contact UsContact Us
-
Statistics and ReportsStatistics and Reports
© 2021 DAKSH India. All rights reserved
Powered by Oy Media Solutions
Designed by GGWP Design