142DETAILED Findings
Who is Accessing the Judicial System?
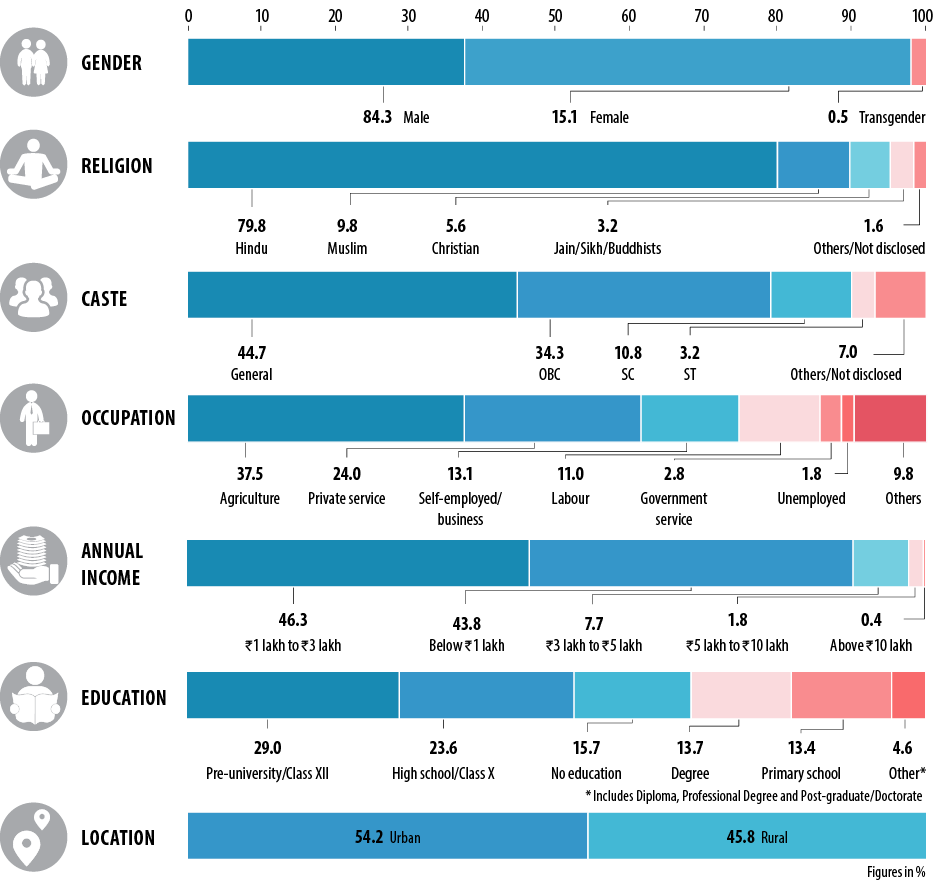
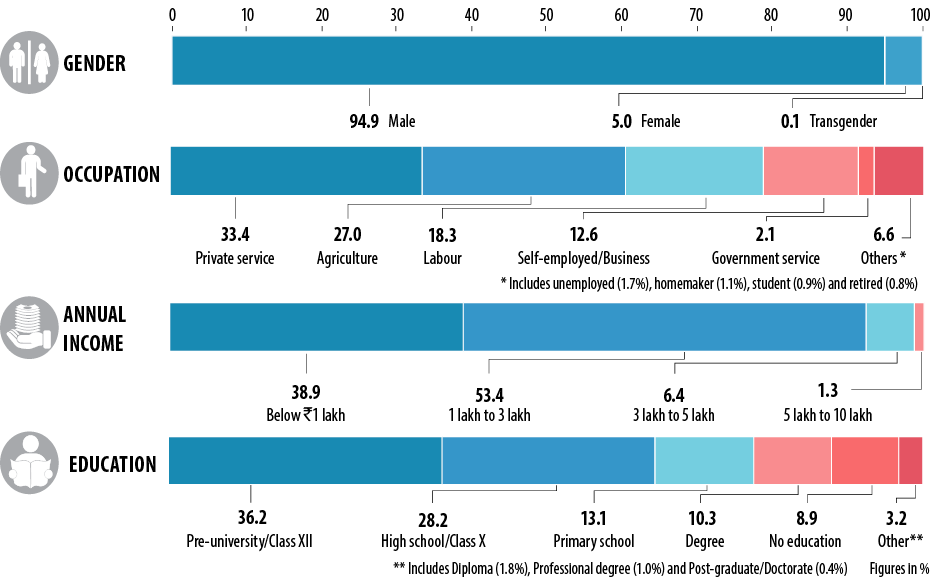
This section contains a summary of the socio-economic profile of the litigant body across civil and criminal questionnaires as per social, economic and institutional parameters. Our survey data is representative of the social profile of the Indian demographic as per Census 2011. Women account for 15% of the survey respondents. This is in keeping with the National Judicial Data Grid data that states that only 14% of litigants in India are female. Survey respondents are primarily composed of individuals fighting against other individuals.
FIGURE 1. Socio-economic Profile of Survey Respondents
143What Are Litigants Using the Judicial
System for?
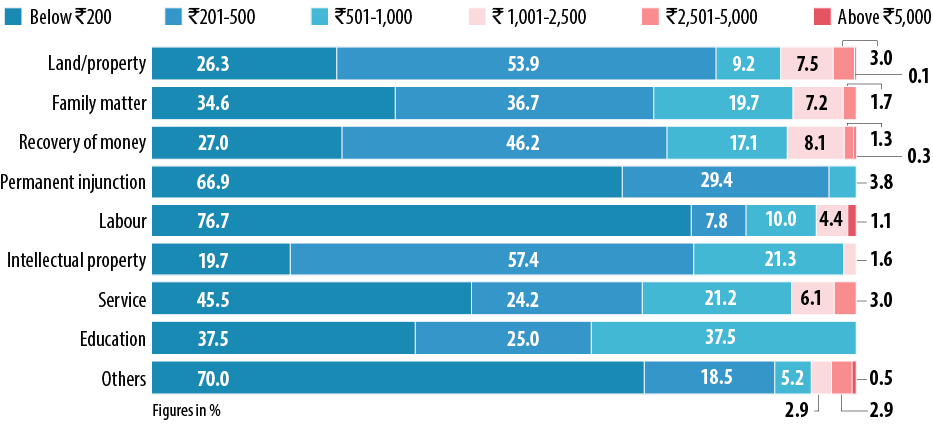
FIGURE 2. Subject Matter of Civil Cases as Per Survey Respondents
Land and property matters dominate civil litigation across the country. This is followed by litigation on family matters.
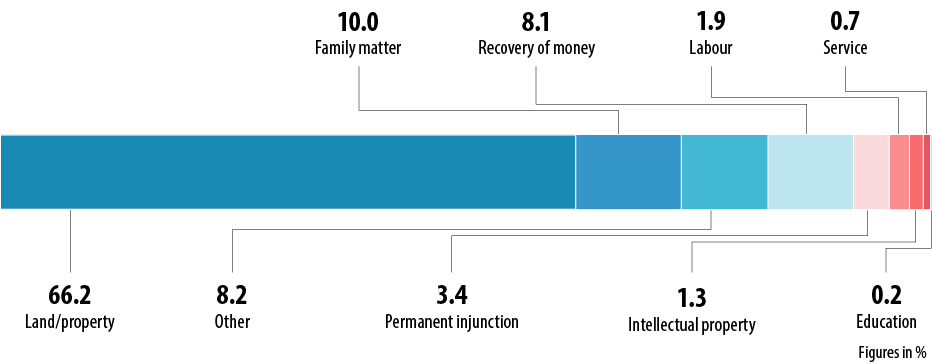
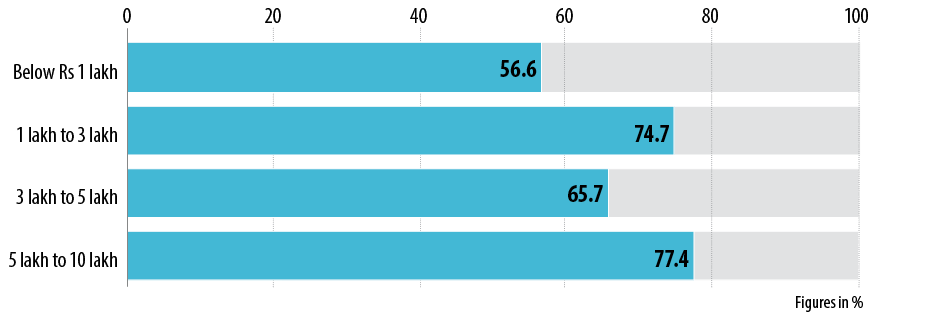
FIGURE 3. Share of Land/Property Cases in Total Civil Cases by Income Group
144FIGURE 4. Gender-wise Break-up of Civil Cases (Plaintiffs and
Respondents)
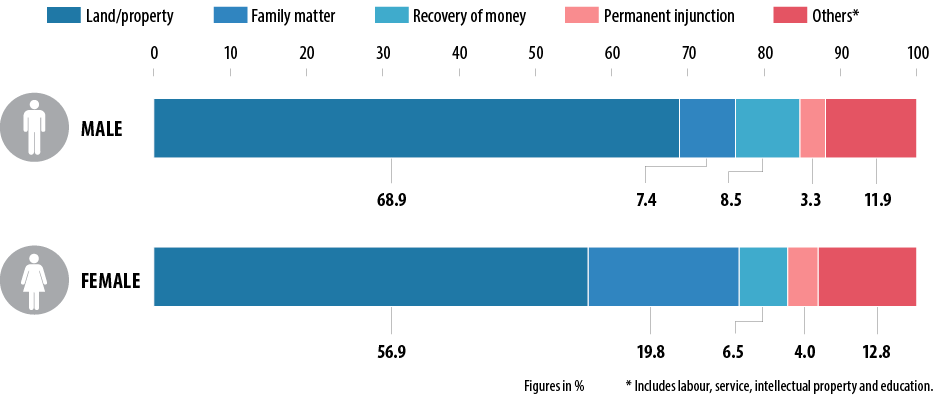
FIGURE 5. Religion Matrix of Civil Cases
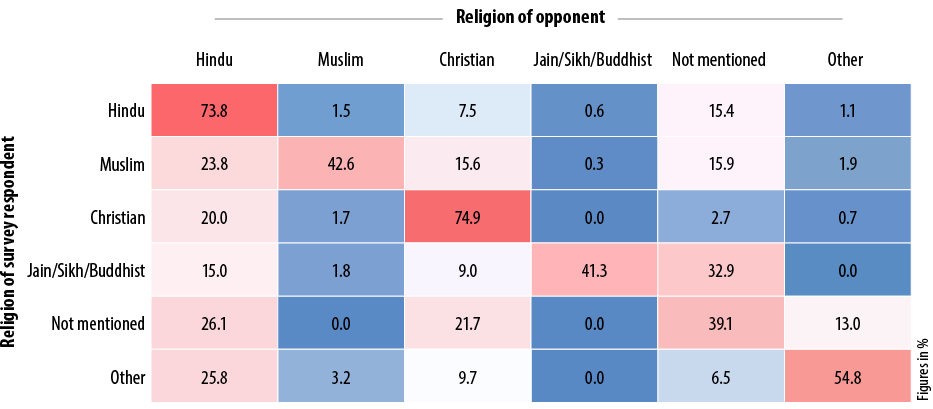
This graph maps civil cases by religion of contesting parties. So, for example, 73.8% of cases by Hindu survey respondents are against other Hindus and 1.5% against Muslims and 7.5% against Christians. The colour spectrum ranges from red (high percentage of cases) to blue (low percentage of cases).
145FIGURE 6. Caste Matrix of Civil Cases
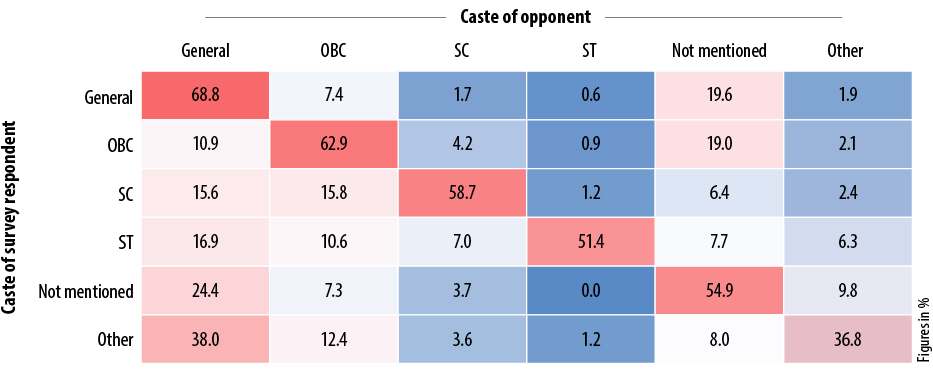
This graph maps civil cases by caste of contesting parties. So, for example, 68.8% of cases by survey respondents of the General category are against others of the same category, and 7.4% against OBCs and 1.7% against SCs. The colour spectrum ranges from red (high percentage of cases) to blue (low percentage of cases).
FIGURE 7. Socio-economic Profile of Survey Respondents Who Were Accused in Criminal Cases
146Figure
8. Profile Matrix of Criminal Cases
Across the board, individuals were seen to be litigating against other individuals, or the government. When the government was the complainant, the opposing party primarily consisted of individuals.
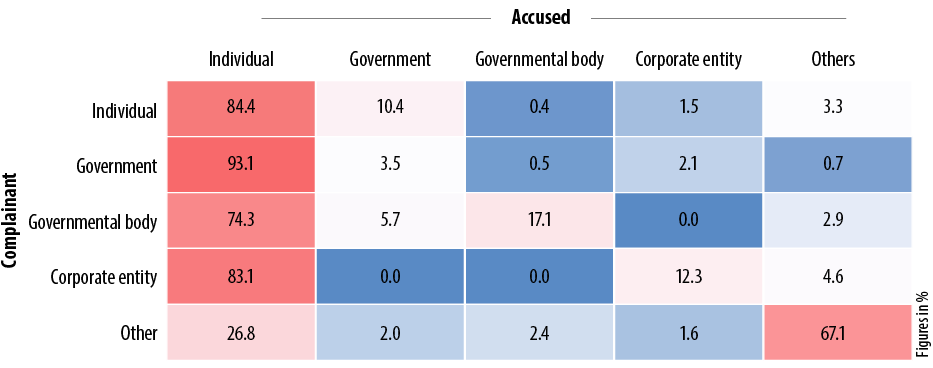
This graph maps civil cases by profiles of contesting parties. So, for example, 84.4% of cases by complainants who are individuals are against other individuals, and 10.4% against the government. The colour spectrum ranges from red (high percentage of cases) to blue (low percentage of cases).
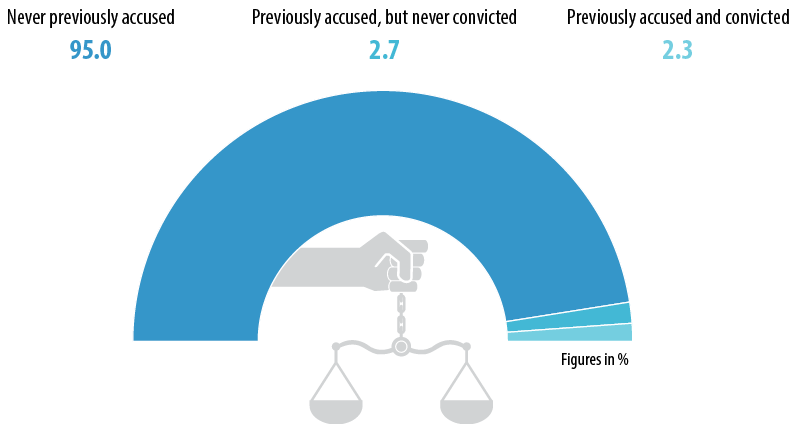
FIGURE 9. Previous Criminal Record of Accused
Amongst the accused surveyed, only 5% had been previously accused in other cases and of these individuals, only 46% were convicted on those charges.
147FIGURE 10. Handcuffing of Accused during Proceedings
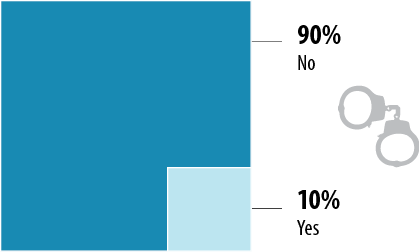
10% of accused were handcuffed within the court premises. Supreme Court guidelines guarantee a minimum freedom of movement which even an undertrial prisoner is entitled to under Article 19 of the Constitution, that cannot be cut down by application of handcuffs or other hoops. [Sunil Batra v. Delhi Administration, (1978) 4 SCC 494, AIR 1978 SC 1675].
FIGURE 11. Provider of Surety for Bail
92% of respondents accused of bailable offences are granted bail
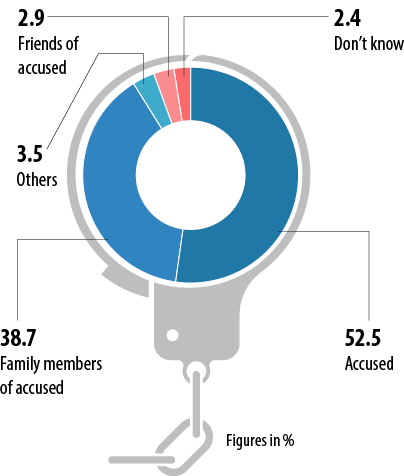
FIGURE 12. Reason for Not Availing Bail Where Due
The main reason individuals could not meet the conditions for bail was due to a lack of sufficient funds.
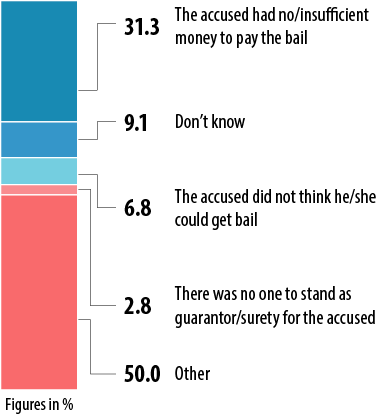
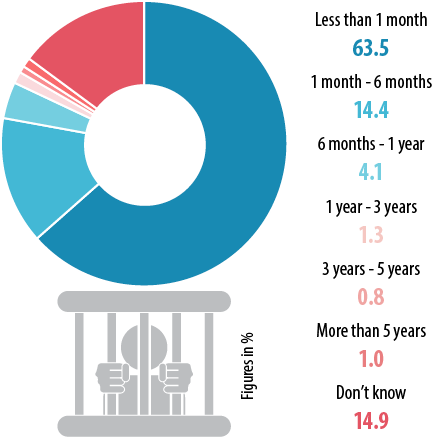
FIGURE 13. Time Spent in Jail by Those Who Were Granted Bail
63.5% of accused who were granted bail were in jail for less than one month.
148Litigants Perception of Delay in Courts
FIGURE 14. Reasons for Delay (in Survey Respondents’ Case)
A clear majority of litigants strongly felt that delay in their cases is caused because judges do not pass orders quickly. They also felt that their cases are getting delayed due to non-appearance of opposite parties on the dates fixed for trial.
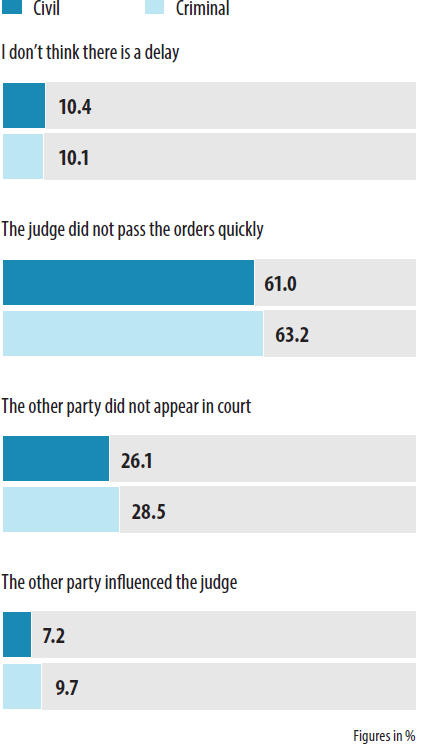
FIGURE 15. Survey Respondents’ Perception for Reasons for Delay in General
Litigants responded that the lack of judges in subordinate courts is the primary reason for delay in general in the courts.
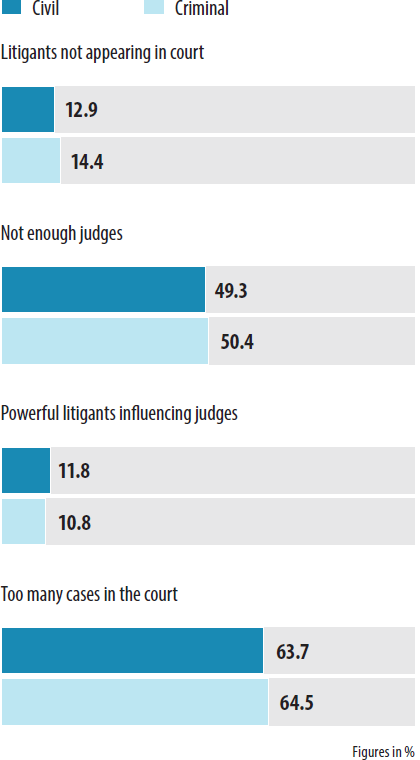
FIGURE 16. Estimated Disposal Time at the Time of Filing Case
149On
asking litigants how much time they expected it would take for their cases to be disposed, we found that 55%
of civil litigants and 67% of criminal litigants expected their cases to be resolved within a year when they
first filed their cases.
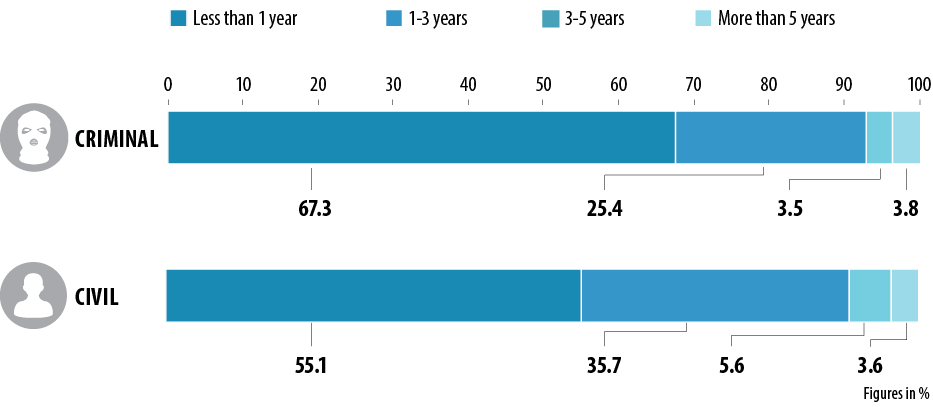
FIGURE 17. Prior Experience with Courts in Civil Matters
Did your previous experience encourage you to go to court this time?
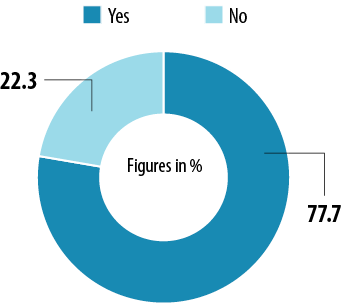
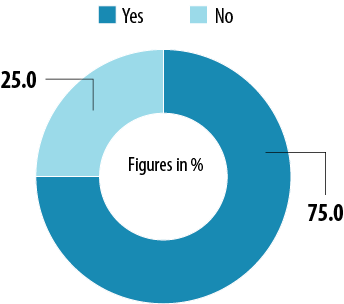
FIGURE 18. Prior Experience with Courts in Criminal Matters
Did your previous experience encourage you to go to court this time?
150Costs of Accessing Justice
We sought to understand the following cost structures:
l Expenditure involved in attending court hearings
l Legal fees
l Opportunity cost of attending hearings (wages and work time lost)
FIGURE 19. Cost Incurred and Earnings Lost for Court Hearing
Civil litigants spend Rs 497 per day on average for court hearings. They incur a loss of Rs 844 per day due to loss of pay. Criminal litigants spend Rs 542 per day for court hearings on average and incurred a cost of Rs 902 per day due to loss of pay.
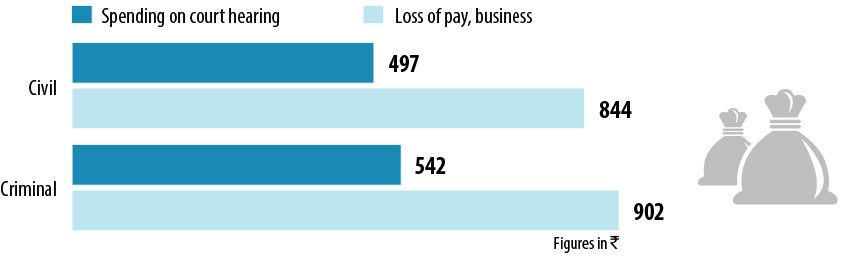
FIGURE 20. Cost Incurred for Court Hearing by Type of Case
Litigants in family matters and service cases spend more on each hearing than other litigants.
151FIGURE 21. Costs Civil Litigants Expect to Incur Till the Case Is
Decided: Income Level-wise
Litigants in the lowest income bracket incur a greater cost over litigation than others.
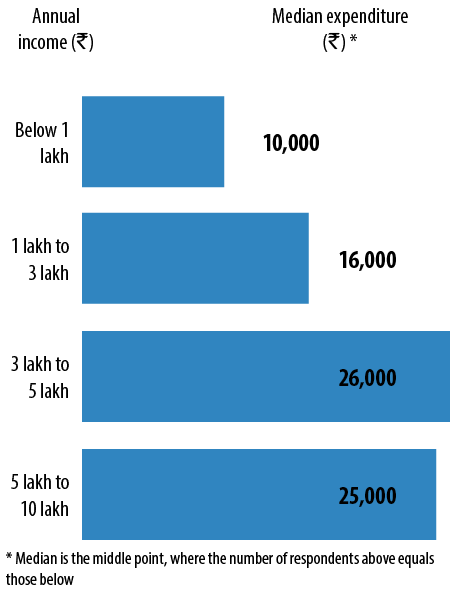
FIGURE 22. Average Cost Per Day
The average daily expenses of plaintiffs is 21% less than that of defendants.
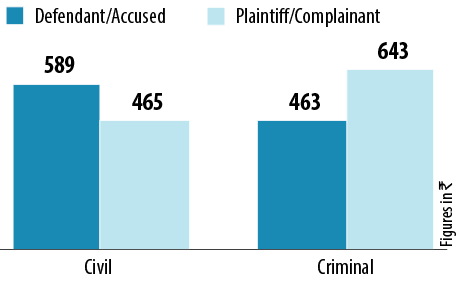
FIGURE 23. Expenses that Litigants Expect to Spend Till the Case Is Decided: Civil versus Criminal

152Expectation and Ability to Appeal
The lowest income group (with an annual income of less than `1 lakh) is seen to be most optimistic about their cases being resolved within one year. 44% of litigants cited expense as a major deterrent for filing appeals in the High Court if their cases were not resolved in their favour.
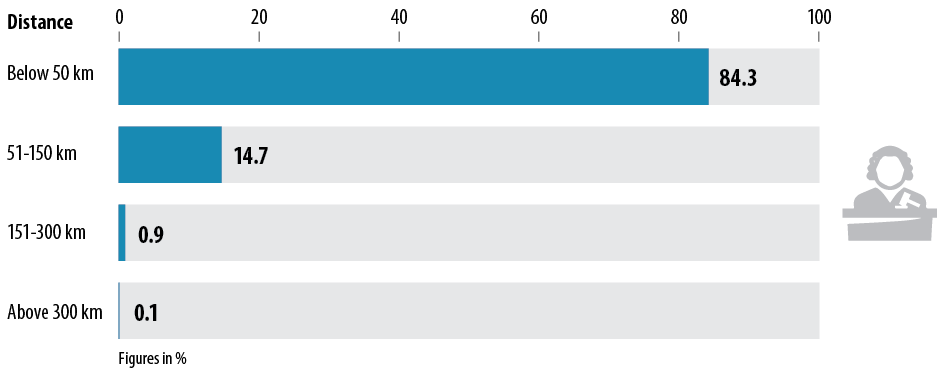
FIGURE 24. Distance Travelled to Court for Hearings
15.6% of all litigants travel between 50 km and 300 km to reach the courts for hearings.
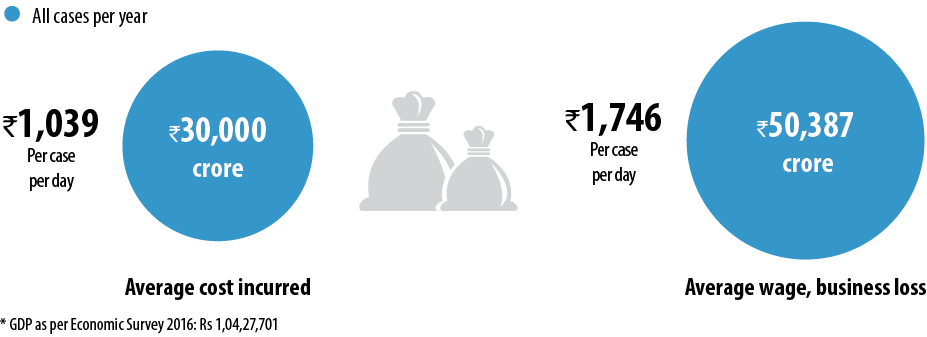
153FIGURE 25. Cost of Litigation
The loss of productivity due to attending court hearings because of wages and business lost comes to 0.48% of the Indian GDP*.
Cases per year

Cost of litigation per year to the litigants
Expectations of Litigants
Estimate of Duration of Case: Civil Cases
56% of litigants expected their cases to be resolved within a year when they first filed their cases. However, on the date of the survey, only 32% litigants had the same expectation.
154Estimate of Duration of Case: Criminal
Cases
When cases were originally filed, 67% respondents expected their case to be disposed of within one year. However, on the date of the survey, only 42% litigants had the same expectation.
Access to Lawyers
Civil Cases
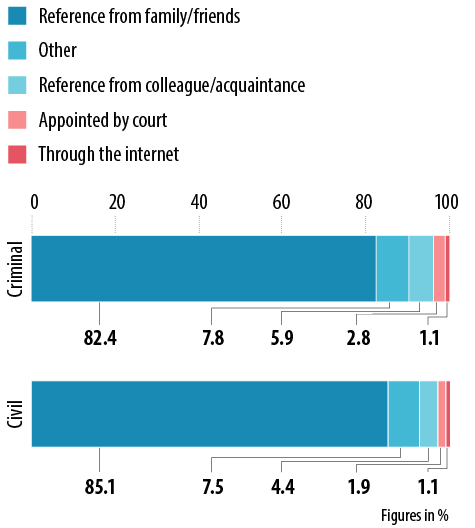
A majority of criminal respondents found their lawyers by way of reference from colleagues and acquaintances, or family members.
Only a meagre 90 respondents were allotted lawyers appointed by the court through legal services authorities (without any fees).
Criminal Cases
A majority of criminal respondents found their lawyers by way of reference from colleagues and acquaintances, or family members.
Only 132 survey respondents were allotted lawyers appointed by the court through legal services authorities (without any fees).
155FIGURE 27. Use of Alternative Dispute Resolution Methods in Civil
Cases
We find that 33% of survey respondents had used ADR methods to settle their cases before approaching the courts.
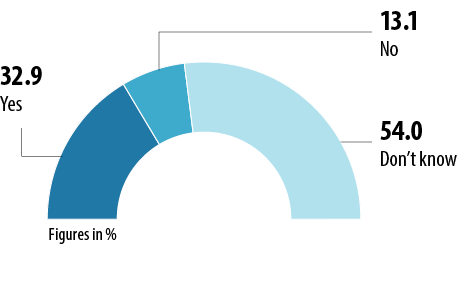
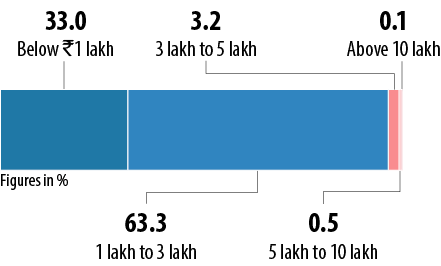
FIGURE 28. Annual Income of Those Who Used Alternative Dispute Resolution Methods in Civil Cases
Out of the litigants who opted for ADR methods, 96.3% litigants belong to the lower income groups with annual income below Rs 3,00,000.